Before they became large companies, with let’s say more than $500 million of annual revenues, they were mid-market companies. And before that, they were small businesses.
They grew. They made mistakes, had competitors take their customers, and they won new business along the way. Business is very dynamic. That’s why you need to know the real numbers in your business.
Big companies measure a lot more than what’s on your financial statements. One common problem of some financial statements is that they list all sales activities into one line called revenues. Even if they segment sales by major category or geography, it’s still not useful to front line managers.
Like a football or hockey coach who evaluates each play and gives their players immediate feedback, managers need real-time information to evaluate performance. They can’t coach very well looking at monthly financial statements prepared in GAAP and not even speaking their same language.
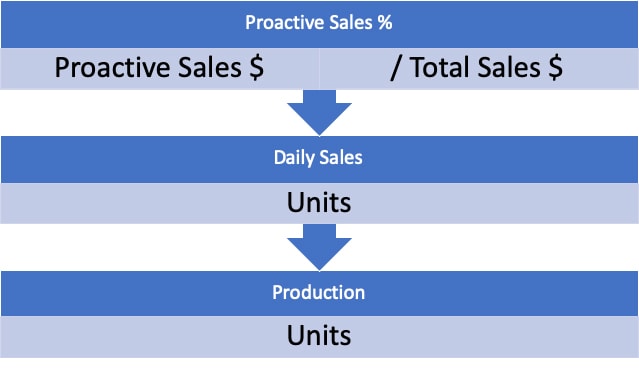
The three most important numbers in your business that aren’t on your monthly financial statements:
- Proactive sales vs. reactive sales percentage
- Daily sales in $ and units.
- Daily production in units.
Figure 49.1: Three metrics not on your financial statements.

- What do your most important numbers tell you about your business?
Proactive Sales %
Proactive sales percentage is simply the amount of sales sold proactively by calling customers vs. total sales for the day of all methods include reactive customer order taking.
If you sold $60,000 proactively and $200,000 in total, then the proactive sales % is $60,000 / $200,000 or 30%.
- What is your proactive sales %?
- How can you improve it?
Daily Sales in Units (or $)
How much did you sell today? You would know the total sales in dollars from the Proactive Sales % calculation above. You can measure this in dollars or in units (if your units, such as billable hours) are fairly homogeneous.
It’s amazing what measuring and communicating your daily sales can do to motivate the sales force and increase awareness throughout the company.
Many companies use annual or monthly budgets. These need to be drilled down to the daily or weekly level to be useful. Some weeks have statutory holidays, so you need real numbers for each week.
Daily Production in Units (or $)
Speaking of increasing awareness in your company, measuring and communicating your daily production is also very powerful because you’re sharing important information.
When you cumulate your total outstanding (but unfulfilled) sales, and divide by your production speed, you now know your production pipeline.
For example, if you have 10,000 units sold and produce 400 per day, you have 25 days in your production pipeline.
If you have 1,000 hours of billable service calls or project work awaiting delivery, and your technicians can deliver 80 hours per day, you have 12.5 days of pure billable time in the queue.
- How much work is in your queue?
- How can you increase the work sold?
- How can you get the work done more quickly?
Measuring what matters is not difficult in your business. These numbers probably don’t exist in your financial statements. But they can be added into most accounting systems and therefore generated within your existing system. The best way to measure your strategy is to measure the operational metrics that directly impact that strategy.

